Support & Resistance
Trend recognition is vital to any successful trading strategy. Let's take a closer look at how traders can profit from trending markets, know when a new trend is underway, and identify indicators that a trend is ending.
What are the support and resistance?
The battle between buyers (demand) and sellers (supply) is the key to price movements. In technical analysis, it creates what we see as resistance and support levels.
When the price of an instrument reaches a level where supply overtakes demand, a rise in price will hit the ceiling and begin to fall. A high in the price is left, and resistance is created.
When an instrument sees demand become greater than supply, this creates a floor in the price, and it will begin to rise. A low is produced, and support is formed.
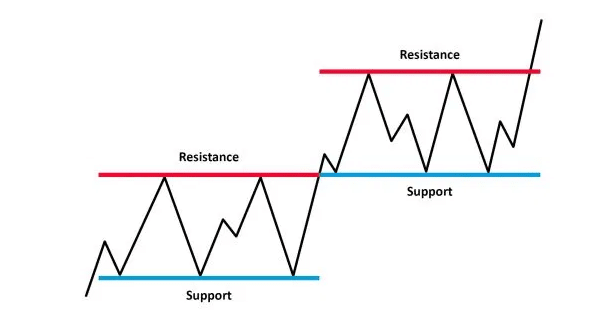
Figure 1: Support and Resistance
As you can see in the above illustration, the lows in price act as support, while the highs indicate resistance. Support shows the levels at which traders are willing to buy, while resistances are the levels at which traders are looking to sell.
These support and resistance levels are significant in terms of market psychology and are the graphical illustration of supply and demand.
In the illustration above, you can also see a break above resistance which then becomes a new level of support.
Old support becomes new resistance and vice versa
Once these levels have been broken, supply and demand and the psychology behind the price movement will both be thought to have shifted. Subsequently, new levels of support and resistance will be established. In this way, once a resistance or support level is broken, its role often becomes reversed.
If the price falls below a support level, that level will become a basis of resistance. If the price rises above a resistance level, it will become a basis of support.
For a true reversal to occur, it is important that the price makes a strong move through either the support or resistance.
Often there can be a pullback to the break level, before continuing in the direction of the break.

Figure 2: Old support becomes new resistance, and vice versa
Trading with Support and Resistance
Analysis of support and resistance is an important part of trend analysis that you can use to inform trading decisions and identify when a trend could be reversing.
For example, if you’re looking to trade long, you can try to identify where important support levels are holding and use them as entry points for trades. Furthermore, if you then identify a level of resistance that has been tested several times but never broken, you might decide to close the position as the price moves toward this level again.
The assessment would be that the market is finding it difficult to breach the resistance, and with upside being limited, the probability of another move back lower is elevated. Traders often use key support levels as a basis for their stop-losses on long positions.
If you’re trading short, you could look at key resistance levels as entry points, and support for potential targets/profit-triggers.
On the chart of USD/JPY shown above, throughout Q2 2019 into Q3, old support levels became the basis of resistance as rallies failed at lower levels, and were sold into. However, market sentiment shifted in September 2019 and this would have resulted in short positions being stopped out.