Trendlines for beginners
What is a trendline?
Trends are arguably the most important concept in technical analysis. A trend can form when the price moves in a sustained direction for some time. A trendline is a simple charting technique where you draw a line to connect prices to represent a trend in the price. Then you use them to show the trend and identify potential reversals.
Identifying trends isn’t always easy. A common accusation aimed at technical analysis is that trendlines can be subjective. However, in any given chart, you’ll notice that prices won’t tend to move in a straight line in any given direction. Instead, there will be a series of highs and lows.
When you see a run of higher lows and higher highs – and they can be linked – then you can look to draw an uptrend. Alternatively, where you see a series of lower highs and lower lows, then it may be possible to draw a downtrend.

Figure 1: The process of building an uptrend
Figure 1 shows a line chart of price movement. As the line moves through a series of higher lows and higher highs, you can link the lows with a straight line to form an UPTREND. For this to remain an uptrend, each successive low cannot fall below the previous lowest point. Otherwise, the trend is deemed a potential reversal of the trend.
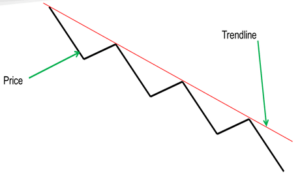
Figure 2: The process of building a downtrend
Figure 2 shows that a decline in prices means that you can draw a downtrend. As the price falls in a series of lower highs and lower lows, you can link the lower highs to form a DOWNTREND.
The market can trend in three ways: an uptrend, a downtrend or in a sideways range.
When there is little movement either higher or lower, with price peaks and troughs failing to drive direction, it is called a sideways or horizontal trend. A sideways trend is not considered a trend on its own. Instead, it signifies a lack of a well-defined trend in either direction. The market is considered to be trading in a range.
Short, Medium or Long Term Trends
There are three-time horizons to classify trends. A trend of any direction can be classified as a long-term trend, medium-term trend, or short-term trend.
Traders and investors may use different time horizons for their outlook depending upon the market they are trading. A forex trader might consider a “long term” to be six months. While an equities investor might consider a long-term trend to be one to two years, medium-term trends in forex trading are often in the range of one to three months; while shorter-term trends could be considered to last a few days up to a few weeks.
The longer-term (primary) trend can be composed of several medium-term trends. Medium-term (secondary) trends can, therefore, move with or against the direction of the primary trend. When the primary trend is an uptrend, and there is a downward correction in price movement followed by a continuation of the uptrend, the correction is considered to be a medium-term trend.
Shorter-term (or ‘tertiary’) trends can be contained within both medium and longer-term trends.
Figure 2: Short, medium and long term trends in Gold

Trading Trendlines
Technical traders will watch trends. Subsequently, trendlines can act as a form of support and resistance. Therefore if a trend is identified, then it can be used for trading signals.
Once an uptrend is identified, a correction back towards the support of the uptrend can be used as a chance to buy. The opposite is seen in a downtrend, where a rally towards the trendline resistance can be an opportunity to sell.
The more often a trendline is used as the basis of support or resistance, the stronger the conviction of the trade. Breaking a trendline will reduce the conviction of market direction and that of the trade. In this way, trendlines can be used for the basis of stop-losses too.
In the charted example of Gold, breaches in trendlines will often come with significant reversals. Once the trendline is broken, there can often be a sharp move as traders see an essential level (either support in an uptrend, or resistance in a downtrend) having been removed. Subsequently, on long positions, having a stop-losses under the uptrends is useful insurance against significant trading losses.
Remember: The Trend is your Friend
The most important saying in technical analysis is “the trend is your friend”. It is important to be able to understand and identify trends so that you can trade with them rather than against them.