Bollinger Bands Ultimate Guide
This popular form of technical price indicator is capable of highlighting areas of support and resistance. We'll show you how to calculate it using three lines drawn onto a price chart near the standard moving average.
What are Bollinger Bands?
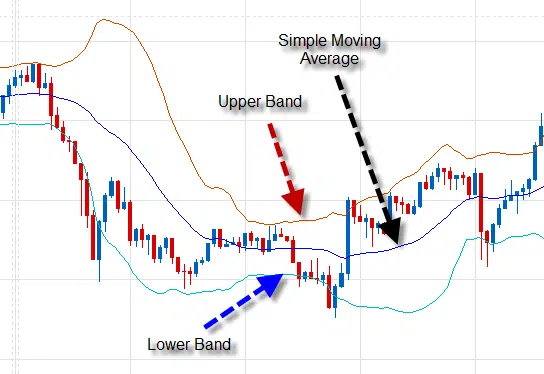
Bollinger Bands are a technical analysis trading tool created by American financial analyst John Bollinger in the early 1980s. They are used as an indicator of volatility and apply the mathematical concept of standard deviations to measure price volatility around a moving average, thereby generating trading signals.
During periods of increased price fluctuation, Bollinger Bands will widen to take this into account. When the fluctuation reduces, the bands subsequently taper with a narrower focus to the price range.
The upper band is the standard deviation multiplied by a given factor above the simple moving average, and the lower band is the standard deviation multiplied by the same factor below the simple moving average.
Which parameters should be used?
Standard deviation is a mathematical concept that is adapted for use in technical analysis through Bollinger Bands. Statistically, prices will disperse around a mean value – in this case, a simple moving average.
68% of price action will vary around the moving average by 1.0 standard deviation. At 2.0 standard deviations, this dispersion increases to 95% of the price action. As much as 99% of the data is contained within 3.0 standard deviations.
Therefore, when the price begins to move towards or outside the standard deviations, it is possible to consider whether this is an extreme move.
For medium-term analysis, Bollinger Bands are typically drawn 2.0 standard deviations away from a 20-day moving average. This means that 95% of the price action should be contained within the Bollinger Bands.
However, this can be tailored depending on time horizons. Tighter parameters will generate more signals, but also increases the potential for false signals as there is the potential for more extreme price movement not being contained within the bands.
For shorter-term trading, you might use a 10-period moving average with 1.5 standard deviations. For longer-term trading, a 50-period moving average with 2.5 standard deviations could be more effective.
You should do your own investigation, for example, backtesting your trading strategy, to determine the parameters that best fit your specific trading style.
Figure 1: Bollinger Bands
Interpreting Bollinger Bands
In isolation, Bollinger Bands don’t produce absolute buy and sell signals. Instead, they indicate whether the price is relatively high or low, allowing for more informed confirmation with other technical indicators.
There are four general rules when following Bollinger Bands:
- When the price hits the upper or lower bands, if other indicators suggest that price movement shows strength or weakness, this could indicate a continuation. If other indicators do not confirm this movement, it can indicate a reversal.
- Tops or bottoms made outside the bands, followed by another top or bottom within the bands, indicate a trend reversal.
- A move originating at one band tends to go to the other band.
- Sharp moves can occur after the bands tighten towards the moving average, as the price breaks out from a period of low volatility. The longer the period of lower volatility, the higher the propensity for a breakout.
Using Bollinger Bands to generate trading signals
There are three main ways that Bollinger Bands can assist trading decisions: breakouts, reversals and range trading.
There are four general rules when following Bollinger Bands:
- When the price hits the upper or lower bands, if other indicators suggest that price movement shows strength or weakness, this could indicate a continuation. If other indicators do not confirm this movement, it can indicate a reversal.
- Tops or bottoms made outside the bands, followed by another top or bottom within the bands, indicate a trend reversal.
- A move originating at one band tends to go to the other band.
- Sharp moves can occur after the bands tighten towards the moving average, as the price breaks out from a period of low volatility. The longer the period of lower volatility, the higher the propensity for a breakout.
1. Breakouts
When Bollinger Bands become very narrow, it’s a sign that the price is consolidating and volatility has become extremely low. However, this narrowing will often occur just before a significant move in the price. As the pressure builds, there can be a sudden burst of price action which can be either higher or lower. The trade is placed in the direction of the breakout.
As part of this breakout, the market could also quickly trade entirely outside the recently broadening set of Bollinger Bands. This is a signal of strength in the move.
Figure 2: A breakout from the Bollinger Bands on EUR/USD

2. Reversals
It is possible to use the upper and lower bands to help identify a potential reversal in price. When the daily range is entirely outside a broad set of Bollinger Bands, this suggests the increased likelihood of a reversal.
This signal reflects the market has made a strong run (either higher or lower), and as part of a blowout, an extreme move is often seen before the market begins to retrace.
It’s important to note how this appears as a reversal signal when the bands are already very far apart – unlike the breakout signal, where the bands are only just starting to expand.
This signal is strengthened by a second top or bottom being made inside the bands.
Figure 3: A reversal using the Bollinger Bands on Gold

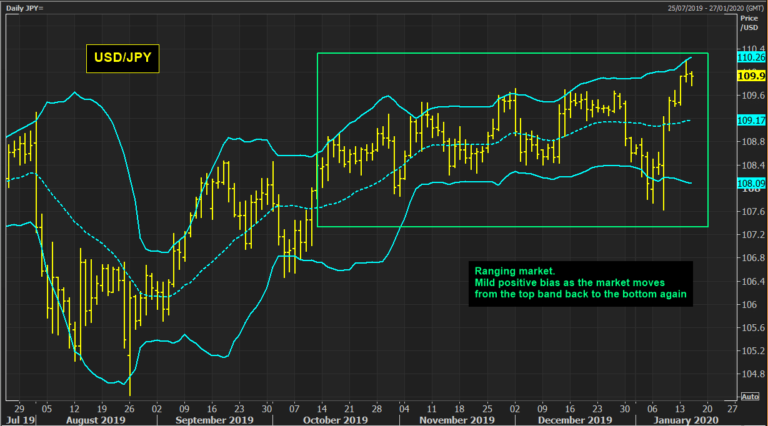
3. Range Trading
In a consolidating market it is possible to use the two bands as a basis for support and resistance. The idea would be to then buy as the price hits the bottom band, and then sell again when the price hits the
top band.
Figure 4: Range trading using the Bollinger Bands on USD/JPY